USDJPY is currently hovering near medium-term resistance, with early momentum indicators hinting at a possible bullish reversal. A break and close above the 50-day SMA could confirm this shift, while failure to sustain above current levels may see the pair resume its broader downtrend.
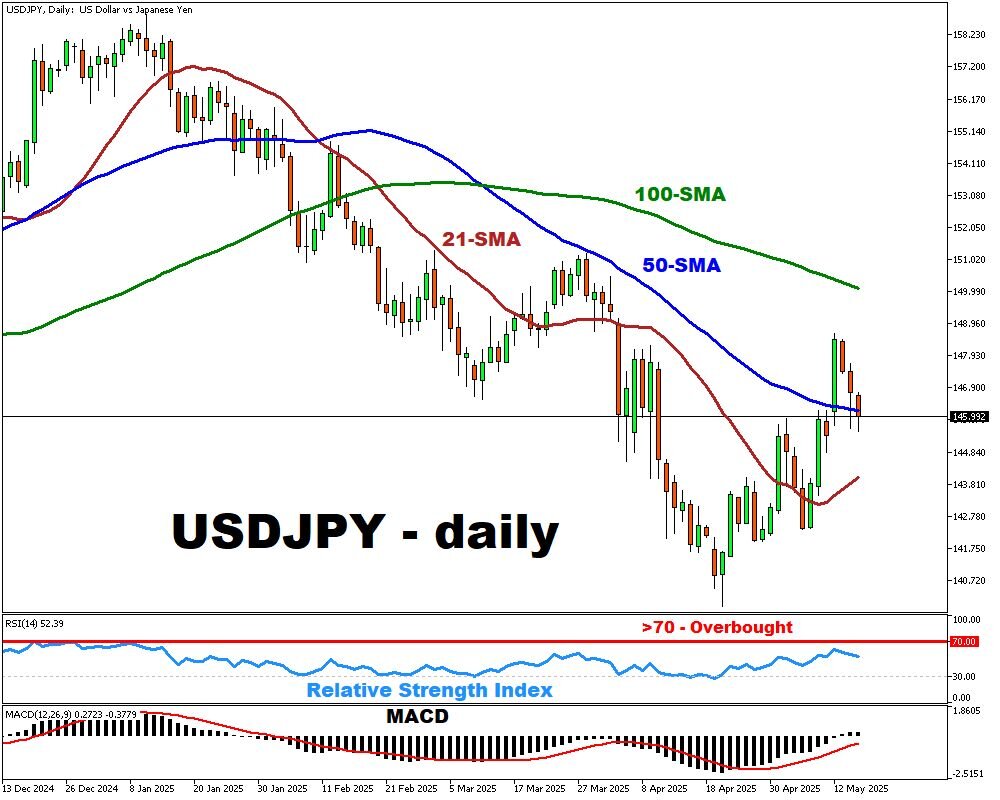
The USDJPY is trading near 145.984, slightly lower than its opening price of 146.660, indicating modest bearish pressure for the day.
From a trend perspective, the Simple Moving Averages (SMA) suggest a mixed picture. The 21-day SMA is at 144.0134, showing that the short-term trend remains supportive of the current price.
However, the 50-day SMA stands at 146.1788, which is now above the current price, indicating the pair is under mild bearish pressure in the medium term. The 100-day SMA is at 150.0820, reinforcing a broader downtrend as the price remains well below this level.
Momentum indicators provide early signs of a potential shift. The MACD (12,26,9) shows a bullish crossover, with the MACD line at 0.2717 and the Signal line at -0.3780, suggesting a possible upside move is forming.
Meanwhile, the Relative Strength Index (RSI) is at 52.36, which is neutral but leans slightly bullish, indicating the pair is not overbought or oversold and may have room to rise.
In summary, USDJPY is currently hovering near medium-term resistance, with early momentum indicators hinting at a possible bullish reversal. A break and close above the 50-day SMA could confirm this shift, while failure to sustain above current levels may see the pair resume its broader downtrend.
Now, traders are looking ahead to Japan's upcoming Japan's GDP data, which could influence expectations for monetary policy and thereby impact the USDJPY pair.